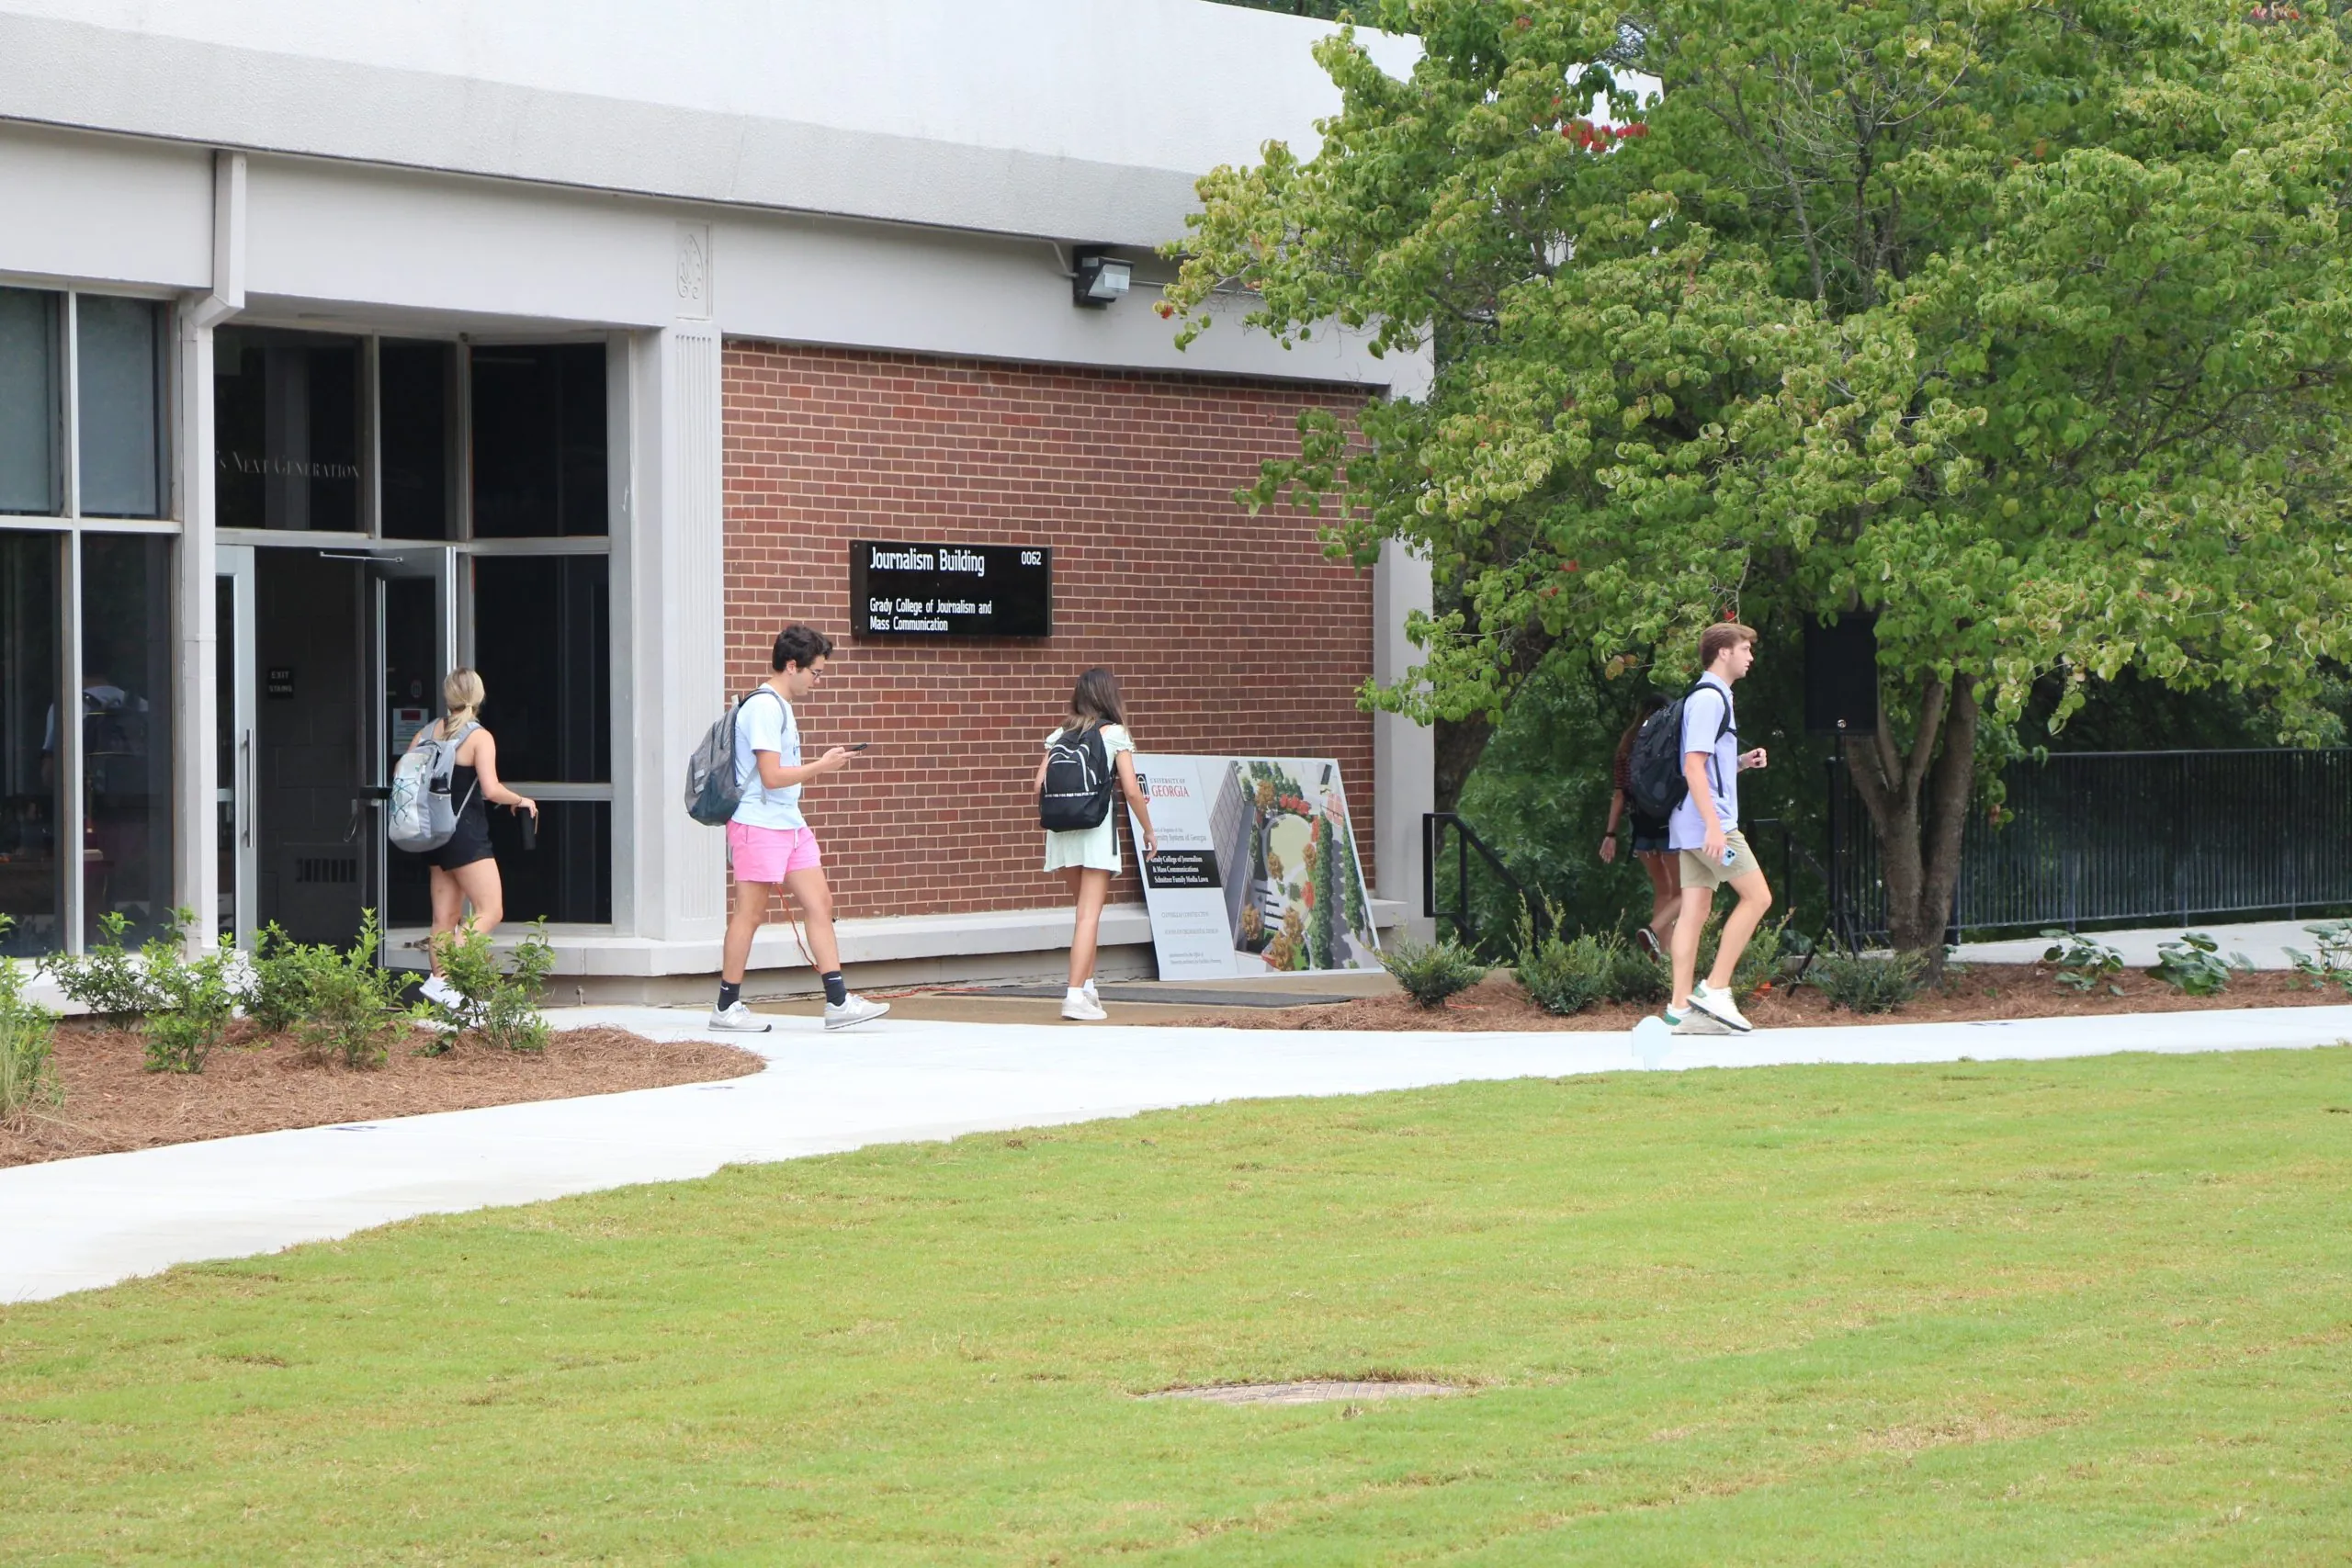
Our College
Our college
Learn more about what makes Grady College one of
the top communications schools in the country.
Our Departments
Sanctioned by the Accrediting Council on Education in Journalism and Mass Communications, Grady College is a leader in journalism research and education. The College is home to several prominent centers and institutes, including the Peabody Awards, recognized as the most prestigious award in electronic journalism. Grady’s faculty includes internationally known researchers and respected industry professionals. Alumni include Peabody Award-winning journalists, Emmy Award-winning producers Cannes Lions Award-winning agency creatives and more.

Advertising
A top-5 nationally ranked program preparing students for careers in the field of advertising.

Entertainment & Media Studies
Innovate through skills and conceptual courses for careers in film and television entertainment.

Journalism
Preparing students in audio, visual and written communications for careers in the digital media world.

Public Relations
Teaching the essential skills in traditional and new media for effective communication.
Grady College


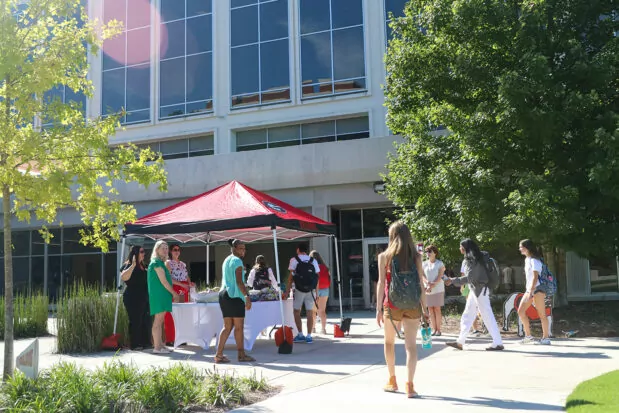
Clubs and Organizations
Involvement with clubs and organizations are excellent ways for students to meet their peers, network with industry professionals and gain hands-on experience with projects and events. The following list features clubs and organizations sponsored by Grady College and/or UGA, which many of our students are involved in.
The Latest
Read the newest headlines, get updates and discover events happening at Grady.


Events